Understanding the Data around Blood Pressure
Welcome! If you're interested in the topic of Blood Pressure, you're in the right place! This site is designed to help consumers like you research and draw meaningful insights from data related to blood pressure, which can provide information about an individual's systolic and diastolic readings and about larger patterns in hypertension prevalence across different locations and sexes and even ages. Using resources from the American Heart Association, Centers for Disease Control and Prevention, and National Library of Medicine, this page explores how blood pressure data can be interpreted at the individual and population level. By comparing information across these resources, you will be able to learn how to classify a blood pressure reading, investigate geographic and demographic trends in hypertension, understand how an individual measurement fits within broader patterns, and even break down a sample analysis of the provided data. This analysis shows how these different sources can be used together to turn blood pressure measurements and statistics into useful knowledge and insights!
Source 1: American Heart Association, Understanding Blood Pressure Readings
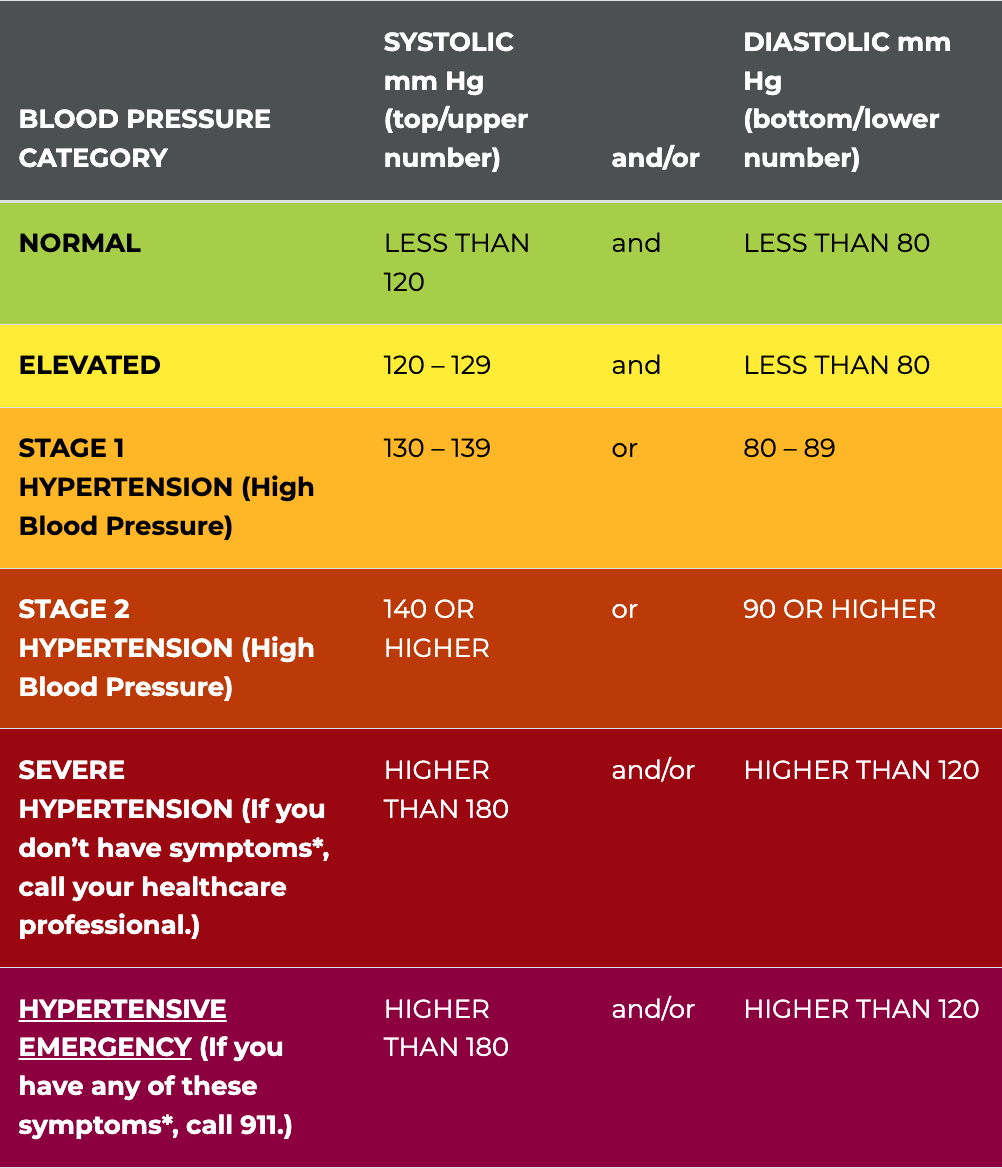
The American Heart Association (AHA) is a wonderful guide for understanding and interpreting blood pressure readings. The site begins by explaining how blood pressure is represented by two numbers. These include the systolic pressure, which measures the pressure against artery walls when the heart beats, and the diastolic pressure, which measures the pressure while the heart rests between beats.
“It’s important to have your blood pressure measured and to understand what your numbers mean.” - AHA
Furthermore, using this resource, a consumer can compare a blood pressure reading with the AHA's categories to understand where the reading falls and whether it may indicate elevated or high blood pressure. This provides a useful starting point for interpreting individual readings before exploring the more detailed risk factors or other blood pressure data through additional resources. Someone at risk with no prior knowledge of their blood pressure health and numbers can gain a substantial head start on their own with the data, rather than having to wait without any insight on what their numbers mean, etc.
Source 2: Centers for Disease Control and Prevention, High Blood Pressure by Location
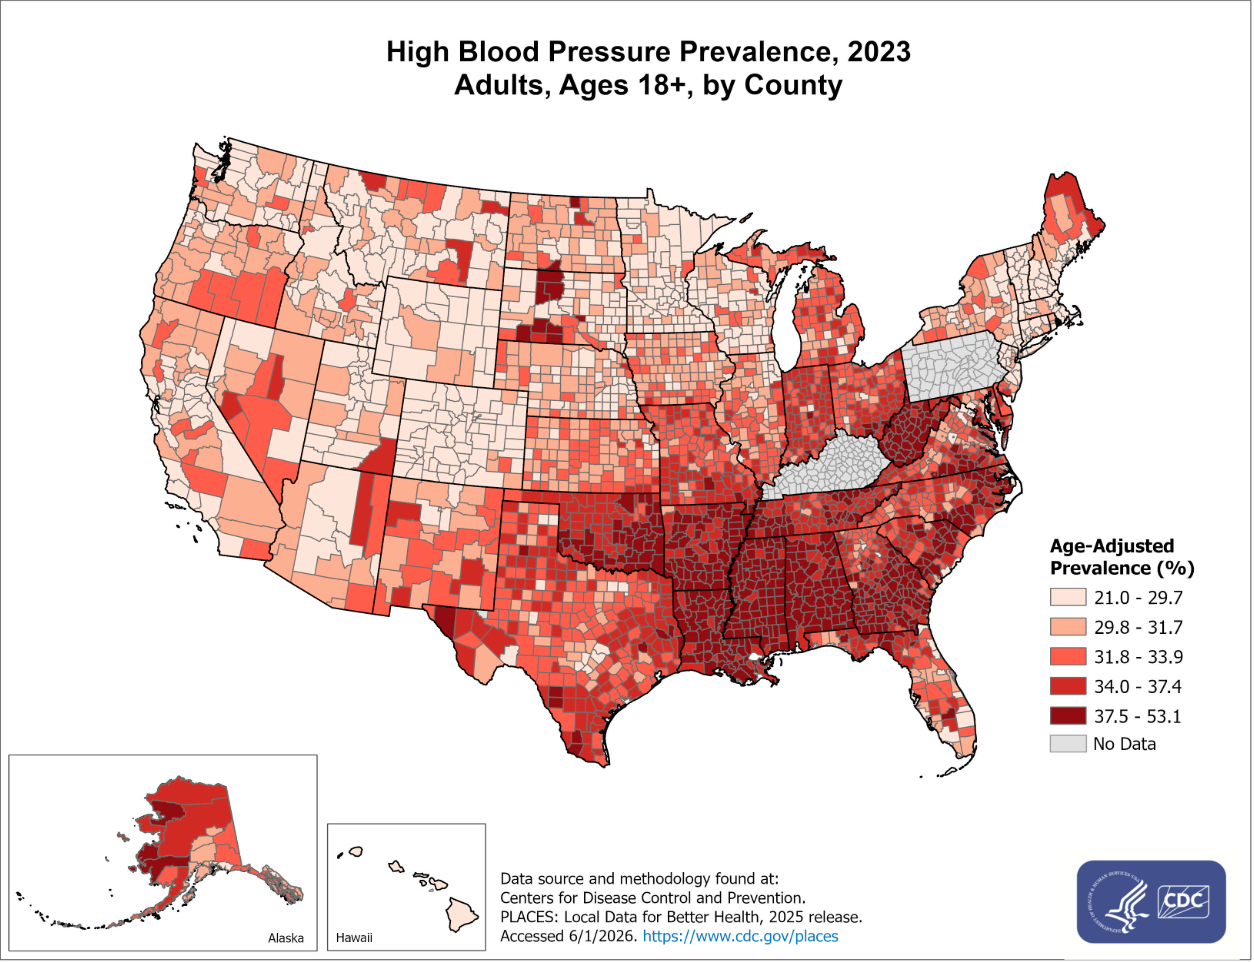
Looking to our second source, the U.S. Centers for Disease Control and Prevention (CDC) provides national data and stats that show how common high blood pressure is across the United States geographically, by county. An individual blood pressure reading is a helpful first step in providing insight into a person's health, but the population-level data reveals much larger, macro-level patterns in where hypertension is most common and which communities may be more affected by it.
The CDC's county-level map of blood pressure prevalence displays the self-reported percentages of adults with hypertension across the United States. This visualization reveals substantial geographic differences and opens a researcher's eyes to looking past the individual level of data research. The data here shows how many of the counties reporting the highest prevalence are located in the Southeast, unlike the West Coast and northern border. The CDC notes that these estimates may generally underrepresent the actual prevalence because some adults with high blood pressure are seemingly unaware that they have it, and therefore did not self-report.
A consumer can use the CDC's data to move beyond their individual measurements and explore broader trends in high blood pressure and how location, among other factors, could be a strong consideration in navigating their blood pressure. Comparing prevalence across counties and regions can help identify geographic patterns and populations where hypertension appears to be particularly common, sparking the need for insight into limiting these disparities and combatting high blood pressure practices or county priorities if there is a substantially high presence.
Source 3: National Library of Medicine, Hypertension Prevalence, Awareness, Treatment, and Control Among Adults Age 18 and Older: United States, August 2021–August 2023
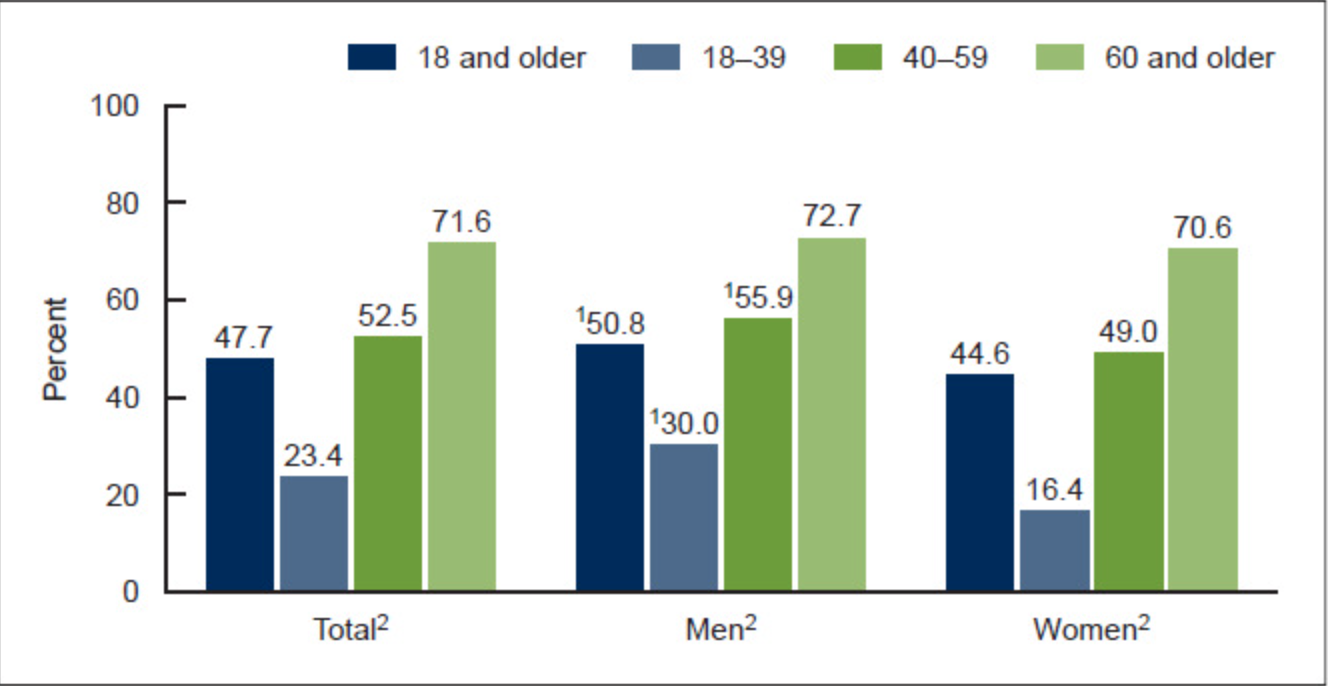
For the third major source for reference, the National Library of Medicine is a great source that provides access to a National Center for Health Statistics report examining the "prevalence, awareness, treatment, and control" of hypertension among U.S. adults. This report uses data from the National Health and Nutrition Examination Survey to allow consumers to compare hypertension statistics across different age and sex groups, to then understand how frequently people with hypertension are aware of and managing their condition. This data is rich in understanding the varying trends across demographics and informs very specific takeaways on hypertension specifically.
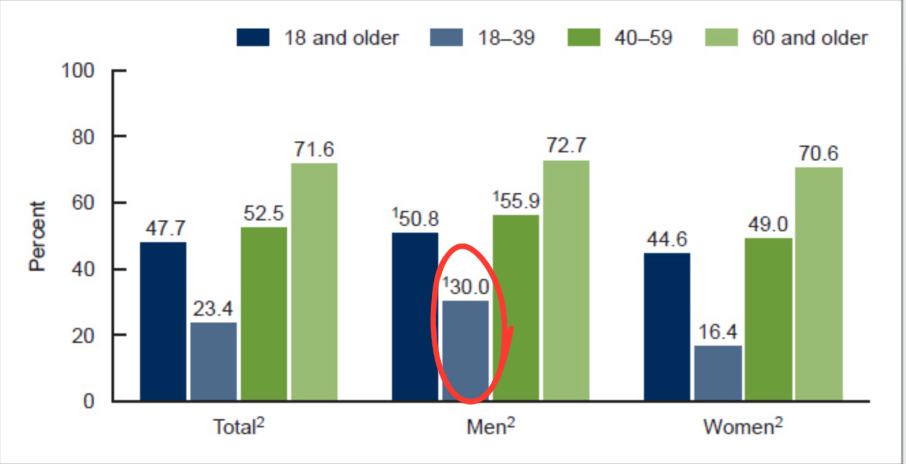
The key takeaway from the data here is that there is a substantial relationship between hypertension and age. Looking at the graphs, overall hypertension prevalence increased from 23.4% among adults ages 18–39 to 71.6% among adults 60 and older, which is roughly triple the percentage. Differences also appear by sex, adding a second layer of analysis for a researcher. We see that hypertension was more prevalent among men overall (50.8%) than women (44.6%).
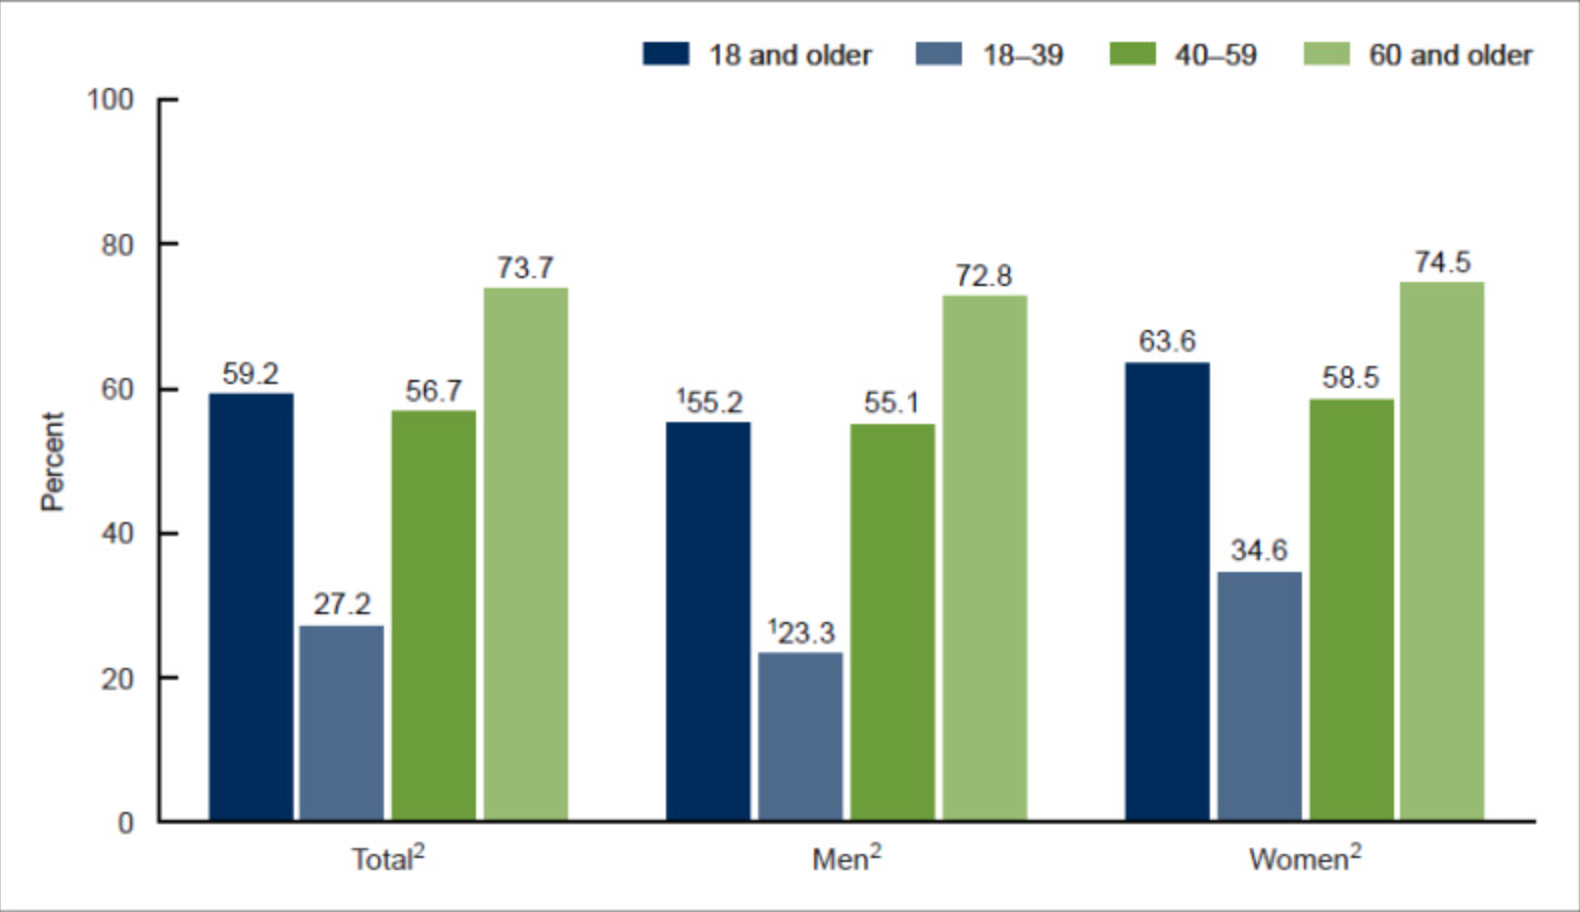
Prevalence of hypertension awareness among adults age 18 and older with hypertension, by sex and age
The second example graphic adds a particularly useful insight as well, that having hypertension and knowing you have hypertension are not one and the same thing. Although 59.2% of adults with hypertension were aware of their condition, awareness ranged from only 27.2% among adults ages 18–39 to 73.7% among adults 60 and older. Likewise, women with hypertension had higher overall awareness than men, at 63.6% compared with 55.2%.
From the provided examples and the full NIH/NCHS report, researchers on blood pressure can use this to compare hypertension prevalence and awareness across key demographic groups. When combined with the AHA's information about interpreting individual blood pressure readings and the CDC's geographic prevalence data, this resource helps put an individual's blood pressure into a broader demographic context, demonstrating how age and sex relate to both hypertension prevalence and awareness!
Sample Analysis: How to Put Blood Pressure Data Into Context
Consider the following: Imagine a hypothetical, 22-year-old man living in Mississippi who receives a blood pressure reading of 135/85 mm Hg from his doctor. On its own, this measurement provides limited context as the raw numbers do not clearly delineate any baseline. By using the three resources presented above, however, he can interpret the meaning of his individual reading and place it within broader geographic and demographic patterns that can be associated with it.
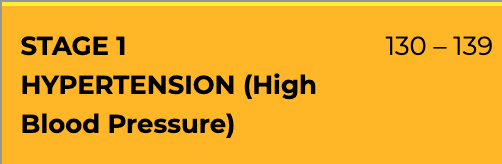
The American Heart Association can be used to interpret the individual reading itself. According to the AHA's blood pressure categories and reference table, a reading of 135/85 mm Hg falls within Stage 1 hypertension, which includes systolic pressure between 130–139 mm Hg or diastolic pressure between 80–89 mm Hg. This provides the first important insight, that although the consumer is young and feeling healthy, his measurement falls outside of the normal and even elevated blood pressure categories. However, a single reading does not establish an individual diagnosis, but the AHA resource allows him to recognize that this measurement warrants further attention.
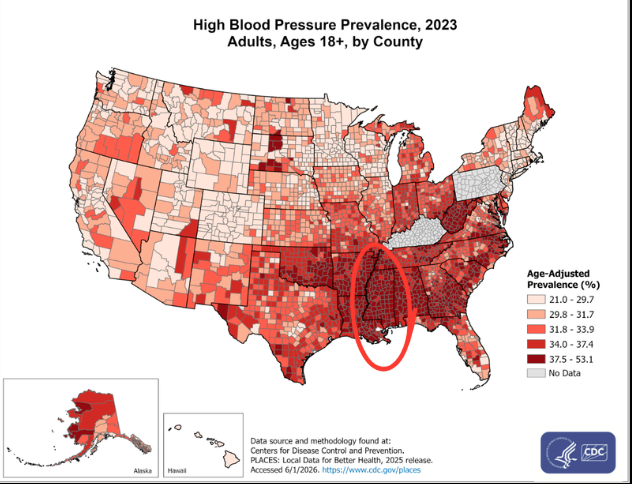
Incorporating our second resource, the CDC data can place this information within a larger, geographic context. The CDC's county-level visualization shows that high blood pressure prevalence isn't evenly distributed throughout the United States as one could assume without context. Many counties with higher percentages of adults reporting hypertension are concentrated in the Southeast region, which includes numerous counties throughout the state of Mississippi. For a consumer living in Mississippi like our hypothetical, the map demonstrates that he lives in a region where hypertension is particularly prevalent compared with many other areas of the entire country. This doesn't mean that his location led to his reading or can calculate his personal risk, but it does provide population-level context that would be invisible from his individual measurement alone.
Our third source, the NIH/NCHS data, can provide demographic context through age and sex. As previously noted, hypertension prevalence increases substantially with age. We noted how 23.4% of adults ages 18–39 had hypertension, compared with the 52.5% of adults ages 40–59 and the 71.6% of adults age 60 and older. Furthermore, within the youngest age group, there is a notable difference by sex, being that hypertension prevalence among men ages 18–39 was 30.0%, compared with 16.4% among women of the same age group. Therefore, while hypertension is considerably less prevalent among younger adults than older adults, the data shows him that it is still present among a substantial portion of young men like himself.