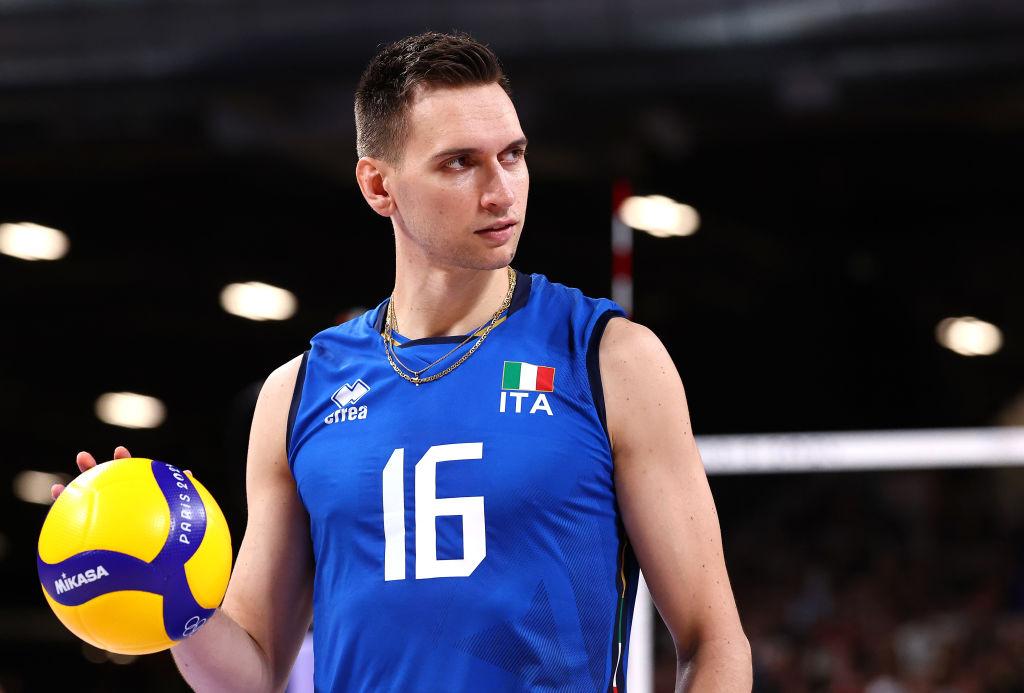
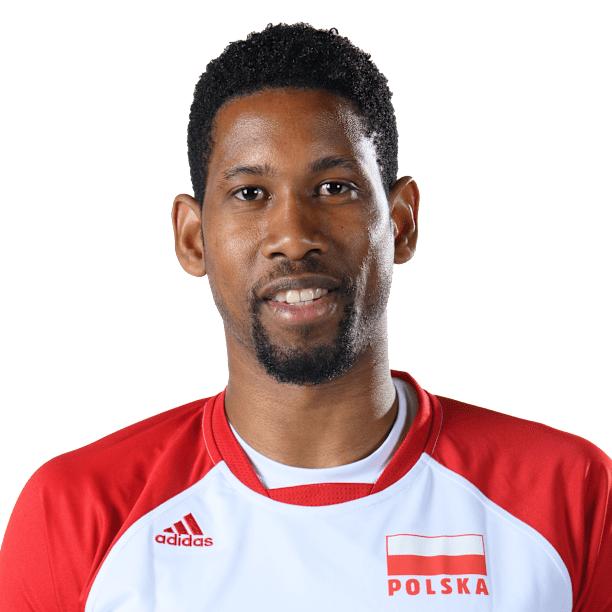
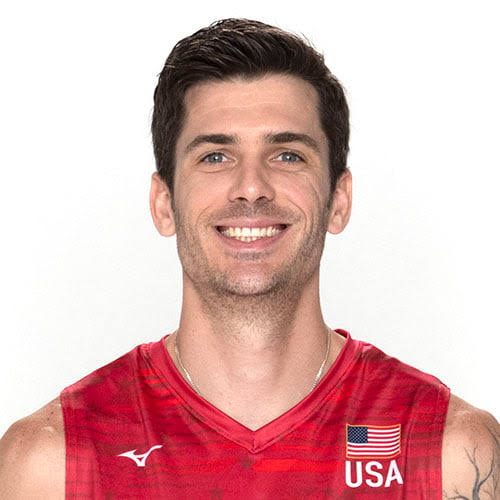
This webpage displays the data for the Top 20 Best Male Attackers in the Paris 2024 Olympic Games
From this data table, we are able to compare attackers on quantitative attributes such as Points, Errors, Success %, and qualitative attributes like Team and Rank. This is important for understanding the players' strengths and how particular teams utilize their attacker. The comparison between attackers is especially important in understanding the reasoning behind one attacker being considered stronger than another.
| Rank | Player Name | Team | Points | Errors | Attempts | Average per match | Success % | Total |
|---|---|---|---|---|---|---|---|---|
| 1 | Romanò | ITA | 88 | 16 | 50 | 14.67 | 57.14 | 154 |
| 2 | Leon | POL | 81 | 28 | 74 | 13.50 | 44.26 | 183 |
| 3 | Anderson | USA | 80 | 20 | 58 | 13.33 | 50.63 | 158 |
| 4 | Russell | USA | 78 | 13 | 53 | 13.00 | 54.17 | 144 |
| 5 | Ngapeth | FRA | 75 | 35 | 61 | 12.50 | 43.86 | 171 |
| 5 | T. Štern | SLO | 75 | 26 | 50 | 18.75 | 49.67 | 151 |
| 6 | Michieletto | ITA | 74 | 13 | 82 | 12.33 | 43.79 | 169 |
| 7 | Patry | FRA | 73 | 19 | 69 | 12.17 | 45.34 | 161 |
| 8 | Clevenot | FRA | 68 | 15 | 38 | 13.60 | 56.20 | 121 |
| 9 | Defalco | USA | 67 | 22 | 53 | 11.17 | 47.18 | 142 |
| 10 | Ishikawa | JPN | 66 | 26 | 53 | 16.50 | 45.52 | 145 |
| 10 | Nishida | JPN | 66 | 21 | 43 | 16.50 | 50.77 | 130 |
| 11 | Kurek | POL | 59 | 30 | 64 | 9.83 | 38.56 | 153 |
| 12 | Lavia | ITA | 57 | 22 | 71 | 9.50 | 38.00 | 150 |
| 12 | Darlan | BRA | 57 | 23 | 29 | 14.25 | 52.29 | 109 |
| 13 | Grozer | GER | 55 | 19 | 40 | 13.75 | 48.25 | 114 |
| 14 | Lucarelli | BRA | 51 | 13 | 43 | 12.75 | 47.66 | 107 |
| 15 | Čebulj | SLO | 50 | 15 | 53 | 12.50 | 42.37 | 118 |
| 16 | Karlitzek | GER | 48 | 11 | 46 | 12.00 | 45.71 | 105 |
| 17 | Ran | JPN | 45 | 19 | 39 | 11.25 | 43.69 | 103 |
Romanò demonstrates the strongest scoring efficiency among the top three attackers. He scored the most points at 88 while making only 16 errors and achieving a 57.14% success rate. Leon scored 81 points with 28 errors and a 44.26% success rate, while Anderson scored 80 points with 20 errors and a 50.63% success rate. This shows that Romanò's top ranking was supported by both high scoring and efficient attacking.
| Player | Points | Errors | Success % |
|---|---|---|---|
| Yuri Romanò | 88 | 16 | 57.14% |
| Wilfredo Leon | 81 | 28 | 44.26% |
| Matthew Anderson | 80 | 20 | 50.63% |
More attacking opportunities do not necessarily result in more points. Leon had the most total attacks of the three at 183, but Romanò scored 7 more points despite having only 154 total attacks. Anderson also scored just one fewer point than Leon with 25 fewer total attacks. Comparing points with total attacks provides more context for how effectively players used their opportunities.
| Player | Points | Attempts | Total |
|---|---|---|---|
| Yuri Romanò | 88 | 50 | 154 |
| Wilfredo Leon | 81 | 74 | 183 |
| Matthew Anderson | 80 | 58 | 158 |